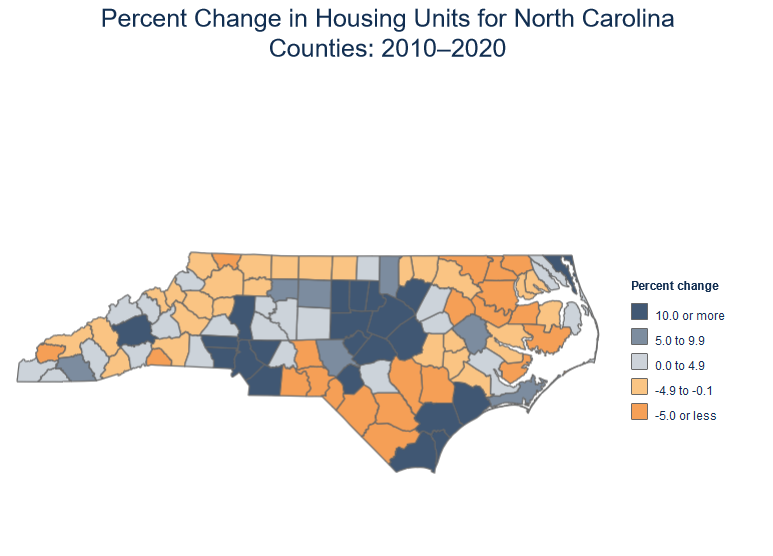
North Carolina added 380,000 housing units in the past decade, an 8.8% increase according to the 2020 Census. During the same period, population increased by 9.5% to 10.4 million, slightly outpacing housing supply. The latest growth rates represent a slowdown from the previous decade (2000 to 2010), when the number of housing units grew by 22.8% and population grew by 18.4%. The Great Recession and the slow recovery that followed reduced demand for new construction in the short term. However, certain parts of the state have continued to see double-digit growth in their housing stock since 2010.

Source: U.S. Census Bureau, 2020 Decennial Census
Counties that experienced the greatest population gains also saw the largest increases in housing. For example, Johnston County saw the biggest increase in population over the past decade at 27.5%, with a 24.6% increase in housing units. In absolute terms, Wake had the largest increase, adding 90,746 units, followed by Mecklenburg, which added 80,456. The counties with the largest percentage increases in housing units between 2010 and 2020 were:
- Johnston (24.6%)
- Wake (24.4%)
- Onslow (23.4%)
- Cabarrus (21.5%)
- Durham (20.2%)
While metropolitan areas saw significant gains, many nonmetropolitan areas were more likely to experience a decline in both population and housing. Nearly half of North Carolina counties lost people and housing units, with Anson losing the highest percentage of its housing stock. Units may be lost due to converted use, demolition, or in some cases, natural disasters. The counties with the largest declines in housing units between 2010 and 2020 were:
- Anson (-15.0%)
- Bladen (-14.6%)
- Graham (-12.1%)
- Columbus (-10%)
- Northampton (-9.5%)
Rural counties, especially those in recreation and tourism areas, also have higher vacancy rates than urban counties with tight housing markets. Dare County, which includes the Outer Banks and has a large share of second homes and seasonal tourism, had the highest vacancy rate at 53.4%, whereas Union County, part of the Charlotte metropolitan area, had the lowest vacancy rate at 4.3%. Meanwhile, the average vacancy statewide is 11.6%. Both very high and very low vacancy rates can present challenges for affordability as low-wage workers often compete for limited housing options.
Taken in April 2020, the Census does not capture the impacts of the pandemic, but it gives insight into the broader demographic shifts that have occurred in the state. As more detailed data, including household size and tenure, from the Census is released in the future, affordable housing practitioners will better understand the needs in their communities.