
Demographics
North Carolina experienced a large population increase over recent years, and a more-than-corresponding increase in households. Between July 2021 and July 2022, the population grew by 133,000 people; including net in-migration of 100,000 people moving to North Carolina from other states. This is the third-highest population growth in the country, after Texas (471,000) and Florida (417,000).[[i]]
Figure 1: Annual Population Increases in North Carolina are Increasing (2010-2022)
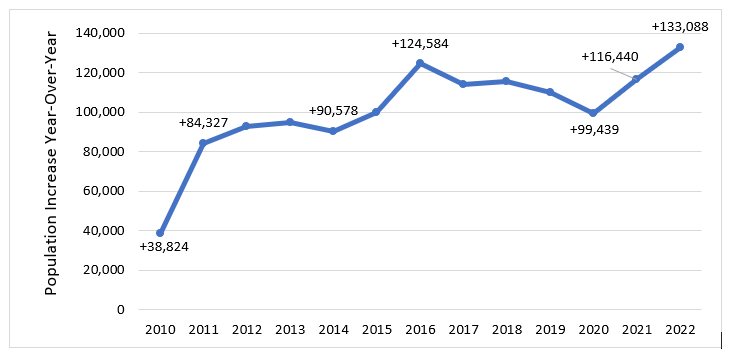
Source: NCHFA tabulations of US Census Bureau Population Estimates, July 2010 - July 2022
Most counties saw a population increase, and those with decreases experienced very modest population declines. The counties with the largest increases from 2020–2022 (Wake, Mecklenburg and Brunswick) saw increases of 22,700 (1.97%), 19,500 (1.74%) and 8,300 (5.70%), respectively. Some of the counties with the largest decreases are rural counties (Halifax, Northampton, Hertford and Martin) where there were declines in the hundreds of individuals, representing population losses between 1.08% and 1.84%.[[ii]]
Statewide, the large population increase puts pressure on the existing housing stock, increasing demand for the available units and consequently increasing prices.
Household Formation
As large as North Carolina’s population growth has been (+9.7% from 2012–2022), the percent growth in households is even larger (+15.2% over that period).[[iii]] Similar trends appear nationwide, according to a Harvard Joint Center for Housing Studies report. Likely explanations for this growth in households include the fulfillment of household formation that had been delayed during the Great Recession, and increased financial ability to form independent households due to dropping unemployment rates, wage increases, pandemic-related federal stimulus payments and paused student loan repayments.[[iv]]
Figure 2: North Carolina Growth in Household Formation Is Outpacing Housing Unit Growth (2012–2022)
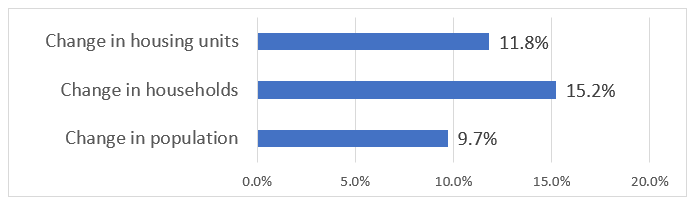
Sources: 2012 & 2022 1-year American Community Surveys, tables DP02 and DP05
North Carolina’s growth in housing stock (+11.8% from 2012–2022) is not keeping up with its growth in households (+15.2% over that period). Over that decade, the number of households in North Carolina increased by 568,000, whereas the housing stock increased by only 517,000.[[v]]
The growth of millennial households is a major contributor to the dramatic growth in overall households. According to Harvard’s Joint Center for Housing Studies, the biggest changes in household growth nationally over the past five years have been among adults under the age of 45. The age cohorts with the largest increases in headship rates (the share of the population heading their own household) were ages 25–34 and 35–44. During the Great Recession, those cohorts experienced the largest declines in headship rates (and the younger cohort had steady declines until 2017), but by 2021 they had recovered to 2011 levels.[[vi]]
This disproportionate growth in households compared to population is putting pressure on the existing stock in addition to the pressure from simple population growth, including in-migration from other states. And the demand pushes housing prices up.
As the state looks toward the future, it is worth noting that the senior population is growing as well. Currently, North Carolina is 8th in count of people 65 and older.[[vii]] By 2040, the 65+ cohort is expected to be 53% larger than in 2020 and the 85+ cohort will have more than doubled.[[viii]] Aging bodies often need housing customization and affording housing on fixed incomes is often a challenge. The long lives of the senior population will influence the type of stock the state will need in the future. Additionally, over time the share of North Carolina’s households which are low-income have been increasing.[[ix]] An Agency blog summarizes the current housing affordability situation for low-income households in the state.
NC Housing Finance Agency Activity
The NC Housing Finance Agency addresses the challenges of housing low- and moderate-income households, including recently-formed households and households that are new to the state, in a variety of ways. It assists with the purchase of homes, funds repairs and rehabilitation to homes with major or urgent needs, finances the development of rental housing for households with modest incomes and provides housing subsidies and development for individuals at most risk of being unhoused or living in institutions. In 2022, it financed affordable homes and apartments for 8,880 households.[[x]] To learn more about these programs, visit www.nchfa.com.
[i] NCHFA tabulations of U.S. Census Bureau Population Estimates, July 2010-July 2022. https://www.census.gov/data/tables/time-series/demo/popest/2020s-counti….
[ii] NCHFA tabulations of U.S. Census Bureau Population Estimates, April 2020-July 2022 https://www.census.gov/data/tables/time-series/demo/popest/2020s-counti….
[iv] McCue, Daniel. (January 17, 2023). The Surge in Household Growth and What It Suggests About the Future of Housing Demand. Joint Center for Housing Studies of Harvard University. https://www.jchs.harvard.edu/blog/surge-household-growth-and-what-it-su….
[v] NCHFA tabulations of U.S. Census Bureau Population Estimates, from American Community Survey (ACS) 2012 and 2022 1-year surveys, tables DP05 and DP02.
[vi] McCue, Daniel. (January 17, 2023). The Surge in Household Growth and What It Suggests About the Future of Housing Demand. Joint Center for Housing Studies of Harvard University. https://www.jchs.harvard.edu/blog/surge-household-growth-and-what-it-su….
[vii] NCHFA tabulation of U.S. Census Bureau Population Estimates, from 2020 American Community Survey (ACS) 1-Year Experimental Estimates, table XK200104. https://www.census.gov/programs-surveys/acs/data/experimental-data/1-ye….
[viii] NCHFA tabulation of OSBM Population Projections, Vintage 2022. https://www.osbm.nc.gov/facts-figures/population-demographics/state-dem….
[ix] NCHFA tabulations of U.S. Census Bureau 5-year Comprehensive Housing Affordability Strategy (CHAS) survey data, for North Carolina, for years 2006-2010 and years 2016-2020.
[x] North Carolina Housing Finance Agency’s 2022 Investment and Impact Report “More Than A Home”. https://2022.housingbuildsnc.com/introduction/.