
The North Carolina Housing Finance Agency recently updated the NC Housing Snapshot with the latest data, offering a clearer picture of housing conditions across the state[i]. This update incorporates the latest figures on home prices, housing cost burden, housing conditions, population trends and development activity. Notably, the data show continued increases in both median rents and home prices, alongside a growing share of households spending more than 30% of their income on housing. The Housing Snapshot also highlights county-level differences, including where demand is rising fastest and where affordable housing shortages are most acute.
The updated Housing Snapshot highlights several emerging and accelerating trends, including:
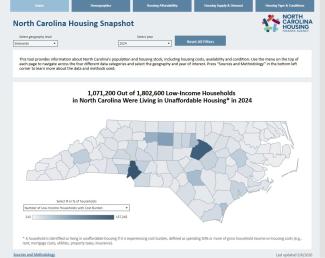
- Cost burden milestone: For the first time, more than one million low-income households[ii] in North Carolina are living with housing cost burden (spending 30% or more of household income on housing costs). The percentage of low-income households experiencing cost burden is highest in Mecklenburg County (74%), Cumberland County (71%), Onslow County (71%), Orange County (71%) and Guilford County (70%).
- Rents and home prices continue to climb: Median rents and median housing costs for owners[iii] continues to rise in much of the state, according to the latest data: 91 counties saw median rents increase from 2023 to 2024 and 78 counties saw median owner costs increase.
- Households with low incomes struggle to afford housing: Households with low incomes continue to be more likely than higher income households to live in unaffordable housing, with a significant majority spending more than 30% of their income—and many spending more than half—on housing each month. According to the latest data, 98% of renter households earning less than $10,000 and 88% of renter households earning between $10,000 and $19,999 experience cost burden, while only 4% of renter households earning more than $100,000 experience cost burden. This trend is consistent for the state’s homeowner households, as well.
- Population shifts are continuing: The 75-84 age group continues to be the fast-growing age segment in the state, signaling rising demand for accessible, elder-friendly housing.
- Vacancy rates tell a mixed story: While statewide vacancy rates increased from 2023 to 2024 (rental rose 1.0 percentage point to 7.4% and homeowner rose 0.1 percentage point to 1.2%), the county-level data reveal a much more complex landscape. Some counties are seeing rising vacancies for one tenure and decreases for the other, while others—particularly fast-growing areas or those with limited housing options—are seeing very low vacancy rates.
- Units for seasonal, recreational or occasional use decrease: The number of homes vacant for seasonal, recreational or occasional use has fallen to its lowest point in at least 15 years—from a high of 218,830 in 2014 to 179,075 in 2024.
Figure 1: NC Housing Snapshot Landing Page
-----------------
[i] All of the data in the Housing Snapshot have been updated, except for the data on homelessness (Demographics tab) and the building permits data (Housing Supply & Demand tab), both of which have not been updated by the original source since the Housing Snapshot was first released in October 2025.
[ii] Households with incomes less than or equal to 80% of area median income (AMI) are low-income. Household income group were calculated using 2024 HOME income limits.
[iii] Median monthly homeowner housing costs, including mortgage, taxes, insurance, utilities, fuels, homeowner association fees, condominium fees, and mobile home costs.