
Unaffordable housing is one of North Carolina’s most pressing challenges. According to the latest data from the Consumer Expenditure Survey, housing is the largest expense for most American households—both renters and owners[i]. Unaffordable housing costs can force families to spend less on basic necessities like health care, food and child care and to underinvest in long-term resources like education or retirement savings. Unaffordable housing costs can also make families accept substandard housing or, in the most serious cases, can push households into homelessness. All of these consequences can have cascading effects on the health and economic well-being of North Carolina and its residents[ii].
Analysis of housing affordability traditionally focuses on cost burden, which are households that spend 30% or more of income on housing costs. However, studying severe cost burden—households that spend more than half of household income on housing costs[iii]—can help affordable housing practitioners and policymakers better understand more extreme forms of housing unaffordability, especially as the state grapples with substantial increases in homelessness.
Throughout the 2010s, the severe cost burden rate in North Carolina was on a strong downward trajectory as the state recovered from the Great Recession, declining from 16.4% of households (578,000) in 2010 to 12.1% (475,000) in 2019. Beginning with the onset of the COVID-19 pandemic, over the next four years, the state’s severe cost burden rate increased to 13.2% (559,000) in 2023 (see Figure 1 below)[iv].
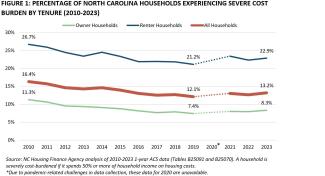
This pandemic-era increase, driven by several years of increasing rents and stagnating wages, occurred among both renter and owner households. Renter households experienced the largest numerical increase in severe cost burden (+39,000 households or +13.8%) from 2019 to 2023 while owner households without a mortgage experienced the largest percentage increase (+24,000 households or +59.6%)[v]. While these owners do not have the monthly expense of a mortgage, many have low and fixed incomes because of retirement or disability and have struggled to manage increases in insurance costs and property taxes (+28% nationally since before the COVID-19 pandemic)[vi].
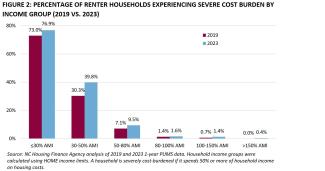
For renter households, the landscape has been even more challenging: North Carolina renter households are nearly three times more likely than owners to experience severe cost burden. While rents have been rising faster than incomes for decades in North Carolina, the economic pressures and rent escalation during the height of the COVID-19 pandemic eroded much of the decline in severe cost burden rates for renter households seen in the 2010s. As shown in Figure 2 below, while unaffordability remained stubbornly high for renters with the lowest incomes, it deteriorated most rapidly for households earning between 30% and 50% of area median income (AMI) during this time period, rising 9.5 percentage points[vii].
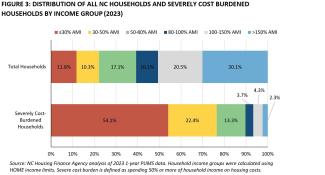
As shown in Figure 3 below, the lowest income households make up the majority of severely cost-burdened households in North Carolina: 54.1% are earning 30% AMI or less and 22.4% are earning between 30% and 50% AMI, despite representing only 11.8% and 10.3% of households in the state, respectively[viii].
The consequences of severe cost burden for these households can be extreme: if a family of four earning $31,000 (30% AMI) in Durham, North Carolina is paying the two-bedroom fair market rent of $1,631, they are spending 63% of their income on rent and have only $952 left each month to cover other expenses[ix]. The US Department of Agriculture’s thrifty food plan estimates that a family of four (two adults and two school-aged children) need to spend $984 per month on food alone[x]. This leaves this household without any remaining funds—in a $32 monthly deficit—for health care, child care, transportation and any other expenses.
The hardships of severe cost burden, especially for the lowest income renters and owners, underscores the importance of the NC Housing Finance Agency’s rental housing production and preservation programs, supportive housing programs, foreclosure prevention counseling resources, home owner repair and rehab financing and community home ownership programs—many of which are designed to serve the state’s most vulnerable households. To learn more about these Agency programs, visit www.nchfa.com.
---------------------------------------------
[i] Bureau of Labor Statistics. 2024. “Consumer Expenditures: 2023.” Available here.
[ii] See, for example: Shamsuddin, Shomon & Colin Campbell. 2021. “Housing Cost Burden, Material Hardship, and Well-Being.” Housing Policy Debate, doi: 10.1080/10511482.2021.1882532. Available here.
[iii] A home is considered “affordable” if a household spends no more than 30% of their income on housing costs (rent, mortgage payment, utilities, homeowners insurance, etc.).
[iv] NC Housing Finance Agency analysis of 2010-2023 1-year ACS data (Tables B25091 and B25070).
[v] Ibid.
[vi] Harvard Joint Center for Housing Studies. 2024. “Housing Cost Burdens Climb to Record Levels (Again) in 2023.” Available here.
[vii] NC Housing Finance Agency analysis of 2019 and 2023 1-year PUMS data.
[viii] Ibid.
[ix] In 2024, 30% area median income is equivalent to a annual household income of $31,750 for a family of four in Durham County. HOME income limits for all metro areas and counties in North Carolina are available here. This analysis also utilized fair market rents (FMRs) published by the US Department of Housing and Urban Development (HUD). FMRs are county-level estimates of the cost to rent a modest rental unit. 2024 FMRs are available here.
[x] US Department of Agriculture. November 2024. “Official USDA Thrifty Food Plan: U.S. Average, November 2024.” Available here.