
The housing construction industry, both nationally and in North Carolina, experienced cost increases since the onset of the COVID-19 pandemic. More expensive construction has led to increased home purchase prices and higher overall development costs for multi-family rental housing, costs which in turn increase rents. Incomes have not risen to compensate, and consequently, households are paying larger shares of their incomes for housing, becoming cost-burdened [i].
On several fronts, housing is becoming more expensive. Home sales prices have risen, interest rates and insurance have increased, prices for construction materials have risen and costs of construction overall are about 30% higher than five years ago. The amount of construction of single- and multi-family housing continues to climb, but less of that construction is at the affordable end of the price spectrum. Low-income buyers find the home buying market less accessible than it was even five years ago.
The market is beginning to show signs of good news in cost stabilization, with some slowing of price increases.
Increasing Housing Prices are Slowing
Both rents and home purchase prices have increased since the start of the pandemic, and recently the price increases seem to be slowing.
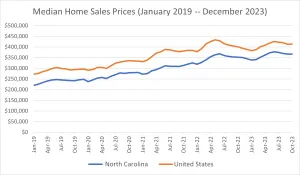
Home sales prices in North Carolina increased 63.4% from January 2019 through December 2023. Over the first four years the median price increased 57% of the 63.4%; the price increase trend may be slowing [ii].
Figure 1: Median home sales prices have increased in North Carolina and nationwide since the start of the pandemic.
Source: Redfin Housing Market data [ii]
A similar pattern has appeared in rents charged for rental housing. Nationally, after years of sizable increases, renters in professionally-managed apartments have seen a modest increase of 4.5% in rents charged from March 2022 to March 2023 [iii]. This is similar to growth in personal income in North Carolina over that period: 5.9% growth for all households combined [iv].
It is worth noting, however, that even though the percent increases are similar, rents that were unaffordable at the beginning of the period continue to be unaffordable to renting households [v].
Housing prices and rents have increased in real terms, as well as in nominal terms.
Median home purchase prices in North Carolina in December 2023 were 51.1% higher than in January 2020, and 63.4% higher than in January 2019 [ii]. In contrast, inflation from January 2019 to January 2024 was 22.5% [vi].
Median rents in North Carolina increased 21.5% from 2019 to 2022 [vii], inflation from December 2019 to December 2022 was 15.5%, less than the increase in median rents [vi].
Construction Materials Cost and Labor are Stabilizing
Materials costs and employment in the construction industry both seem to be stabilizing, although construction starts continue to experience delays.
Employment in North Carolina's construction industry has returned to levels similar to before the Great Recession that began in 2008, both in terms of its share of the state's GDP (4.1% of the state's GDP) [viii] and in terms of its share of the state's employment (4.9% of the state's employed workforce) [ix]. Only 4% of responders in a December 2023 national survey by the National Multifamily Housing Council (NMHC) reported staffing shortages (which is down from 18% the prior December and well below the 43% who reported this in March 2022) [x].
In that survey, 84% of responding construction and development firms had experienced construction delays over the prior quarter, and 92% reported delays in starts. Major reasons cited included delays in permitting, economic uncertainty, unavailability of construction financing and economic infeasibility. Only 8% reported delays in the start of construction due to materials sourcing and delivery (down from 30% the prior December and 64% in March 2022) [x].
Material costs have contributed to the overall construction cost increase equation. During the pandemic, prices for lumber soared, spiking with a 74% increase from January 2019 to the peak in March 2022, followed by prices decreasing and plateauing over the last year [xi]. December 2023, NMHC survey respondents reported lumber prices decreasing on average, over the prior quarter, for the seventh quarter in a row [x].
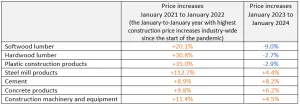
The costs for construction materials also appear to be steadying; specific materials' increases are lower than recent years, and some prices have even been declining [xii].
Figure 2: Since the period of highest price increases, construction costs for some critical materials have increased more slowly or decreased.
Source: Bureau of Labor Statistics PPI Detailed Reports dated January 2022 and January 2024 [xii].
Impacts of this trend
In North Carolina, according to 2022 survey data from the Association of General Contractors, construction contractors reported adopting a variety of strategies in response to the rise in material costs. These included absorbing the additional costs (27% of responders), changing suppliers or specifications (47%) and passing on some or all of their additional costs (63%) [xiii].
Inflation and Residential Construction Costs
Inflation and housing construction costs are both higher than before the pandemic.
According to the Bureau of Labor Statistics (BLS) Consumer Price Index, prices inflated 19.6% over the four years from January 2020 to January 2024, compared to 8.9% over the prior four years [vi]. National inflation from January 2010 (during the Great Recession) to January 2024 was 42.3%; January 2019 (pre-pandemic) to January 2024 saw inflation of 22.5% [vi].
Overall construction costs did not merely keep pace with inflation; they outstripped it.
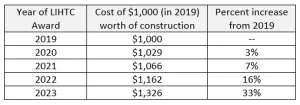
The NC Housing Finance Agency finances around 6,000 units of affordable rental housing each year. Because the units are modest and designed to be affordable, the costs to develop them tend to be lower than the costs of market-rate rental housing. Nonetheless, the increasing costs in the construction industry overall have impacted the cost of their construction. The Agency's multi-family new construction developments funded with 9% and 4% tax credits from 2019 (pre-pandemic) through 2023 shows this trend of increasing costs: construction costs have increased 33% since 2019 (a higher rate of increase than inflation over those years) [xiv].
Figure 3: Construction costs for new multi-family housing units that are affordable to households at or below 60% of the area median income have increased in North Carolina since the pandemic.
Source: NC Housing Finance Agency internal data from awarded projects' applications. These are increases in hard costs only and exclude soft costs and land.
Based on shifts seen in the construction costs, the Agency updated programs to dedicate additional financial resources to each project (rental construction and rehabilitation, home buyer down payment assistance and rehabilitation of owner-occupied homes) to ensure continued production and rehabilitation of North Carolina's affordable housing stock.
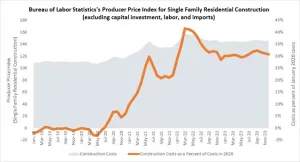
The BLS Producer Price Index also shows construction costs for single-family residential construction have soared since the pandemic. Costs have generally increased since the start of the pandemic (shown in grey, in Figure 4), and have recently leveled out slightly below the March 2022 peak. The orange line on that chart shows the costs as a percent of what they were in 2022. Construction in 2023 cost roughly 31% more than prior to the pandemic, having stabilized approximately 10 percentage points below the March 2022 peak [xv].
Figure 4: Residential construction costs (nationwide) are stabilizing on average.
Source: NC Housing Finance Agency tabulations of Bureau of Labor Statistic's Producer Price Index data, delivered by St. Louis Federal Reserve [xv].
Volume of Residential Construction
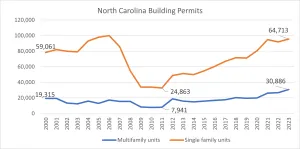
Despite increase in material costs, construction of both single-family and multi-family housing units have increased over the last decade.
Figure 5: Both single-family and multi-family construction permits have increased since 2011.
Source: US Census Bureau Building Permits Survey [xvi].
Although the building permit data show an upward trend over the past decade, new construction (indicated by housing starts) has declined in the last two years, from close to 1.8 million per year to approximately 1.5 million per year [xvii]. The South, which saw a similar decrease [xviii], accounts for roughly 58% of the nation's housing starts [xix].
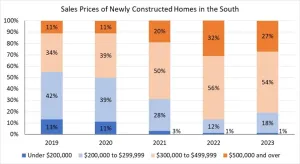
There was particular decline in construction at the lower end of the home buyer market both nationwide and in the South. Across the US in 2023 less than 1% of the newly-constructed privately owned homes sold were sold for less than $200,000 and 13% were sold for between $200,000–$299,999 [xx]. In contrast, prior to the pandemic a much larger share of the new construction homes in the US sold at the lower end of the market. In 2019, 10% of new construction homes sold for less than $200,000, and another 33% in the $200,000–$299,999 range [xxi]. Figure 6 shows the same thing is happening in the South: a smaller share of the new homes constructed are sold at the lower end of the market.
Figure 6: Construction at the lower end of the home buyer market has declined in the South.
Source: US Census Bureau and HUD data from the New Residential Sales press release [xxii].
Note: Percent totals may not sum to 100% because of rounding.
NC Housing Finance Agency Activity
The NC Housing Finance Agency's activity was impacted by the increasing construction costs and delays to obtain materials, similar to the rest of the construction sector. In response to the changing market, the Agency has dedicated additional funding for each project to ensure housing production continues to help North Carolinians in need of quality affordable housing. The Agency remains a critical resource, financing affordable housing construction under its primary affordable rental housing program (the Low-Income Housing Tax Credit program), and financing rehabilitation work under a variety of programs. And it continues funding the purchase of homes by providing both affordable mortgages and down payment assistance. For information about the programs and activities the Agency offers, visit https://www.nchfa.com/.
[i] See the Agency’s blog “Who is Experiencing Housing Cost Burden in North Carolina?” for an exploration of this topic.
[ii] NCHFA tabulation of Redfin “United States Housing Market” data from https://www.redfin.com/us-housing-market and Redfin “North Carolina Housing Market Data” from https://www.redfin.com/state/North-Carolina/housing-market obtained March 22, 2023.
[iii] The State of the Nation’s Housing. Joint Center for Housing Studies of Harvard University. https://www.jchs.harvard.edu/sites/default/files/reports/files/Harvard_JCHS_The_State_of_the_Nations_Housing_2023.pdf.
[iv] NCHFA tabulation of data from the Bureau of Economic Analysis, Table 1. Personal Income, by State and Region, 2022: Q1–2023: Q2. Data from https://www.bea.gov/news/2023/personal-income-state-2nd-quarter-2023.
[v] See the Agency’s blog “The Impact of the Low-Income Housing Tax Credit in North Carolina” for an exploration of this topic.
[vi] US Bureau of Labor Statistic’s CPI inflation calculator. https://www.bls.gov/data/inflation_calculator.htm.
[vii] NCHFA tabulations of US Census Bureau median rents in North Carolina, from American Community Survey (ACS) 2010–2022 one-year surveys, table S2503. As of publication, no one-year data more recent than 2022 was available from this data source, nor was one-year data available from the year 2020.
[viii] US Bureau of Labor Statistics. North Carolina statewide construction industry employees, in thousands, from 2000–2023 https://data.bls.gov/timeseries/SMS37000002000000001?amp%253bdata_tool=XGtable&output_view=data&include_graphs=true.
[ix] NCHFA tabulation of Bureau of Labor Statistics employment data for 2000–2023. Original data from https://www.bls.gov/regions/southeast/north_carolina.htm#eag.
[x] A December 2023 survey of 31 multifamily housing construction and development firms around the nation. Information pulled from https://www.nmhc.org/research-insight/nmhc-construction-survey/2023/quarterly-survey-of-apartment-construction-development-activity-december-2023/.
[xi] NCHFA tabulations of data from the US Bureau of Labor Statistic’s Producer Price Index data for the Wood Products Manufacturing industry (Series ID PCU-321). https://data.bls.gov/timeseries/PCU321---321---?amp%253bdata_tool=XGtable&output_view=data&include_graphs=true. Accessed February 21, 2024.
[xii] Bureau of Labor Statistic’s PPI Detailed Report January 2024 https://www.bls.gov/ppi/detailed-report/ppi-detailed-report-january-2024.pdf and PPI Detailed Report January 2022 https://www.bls.gov/ppi/detailed-report/ppi-detailed-report-january-2022.pdf. These figures came from Table 2 and Table 7 of each report.
[xiii] Association of General Contractors 2022 Workforce Survey. https://www.agc.org/sites/default/files/users/user21902/2022_Workforce_Survey_NC_M%20(3).pdf. The 2003 survey did not contain a parallel question.
[xiv] These figures include construction costs only. They are not the full costs to develop the housing; they leave out land costs and soft costs.
[xv] NCHFA tabulations of St. Louis Federal Reserve Economic Data, WPUIP231110, through December 2023. https://fred.stlouisfed.org/series/WPUIP231110.
[xvi] NCHFA tabulations of data from the US Census Bureau Time Series and Table Tool. https://www.census.gov/construction/bps/visualizations/datatool/index.html.
[xvii] Non-seasonally adjusted housing starts, from US Census Bureau and HUD series table “Annual Rate for Housing Units Started: United States”. Data from February 2022 and February 2024. https://www.census.gov/econ/currentdata/?programCode=RESCONST&startYear=2000&endYear=2024&categories[]=ASTARTS&dataType=TOTAL&geoLevel=US&adjusted=1¬Adjusted=0&errorData=0#table-results
[xviii] Non-seasonally adjusted housing starts, from US Census Bureau and HUD series table “Annual Rate for Housing Units Started: South”. Data from February 2022 and February 2024. https://www.census.gov/econ/currentdata/?programCode=RESCONST&startYear=2000&endYear=2024&categories[]=ASTARTS&dataType=TOTAL&geoLevel=SO&adjusted=1¬Adjusted=0&errorData=0#table-results
[xix] NCHFA tabulations of data from the US Census Bureau and HUD Series Tables “Annual Rate for Housing Unites Started” for the United States and the South.
[xx] US Census Bureau and HUD report “Monthly New Residential Sales - December 2023”. https://www.census.gov/construction/nrs/pdf/newressales.pdf.
[xxi] US Census Bureau and HUD report “Monthly New Residential Sales - December 2020”. https://www.census.gov/construction/nrs/pdf/newressales_202012.pdf.
[xxii] NCHFA tabulations of data from the US Census Bureau and HUD data from the New Residential Sales press release. https://www.census.gov/construction/nrs/data/series.html.